Aug 9 2026
Another exciting milestone for my AI SQL Agent!
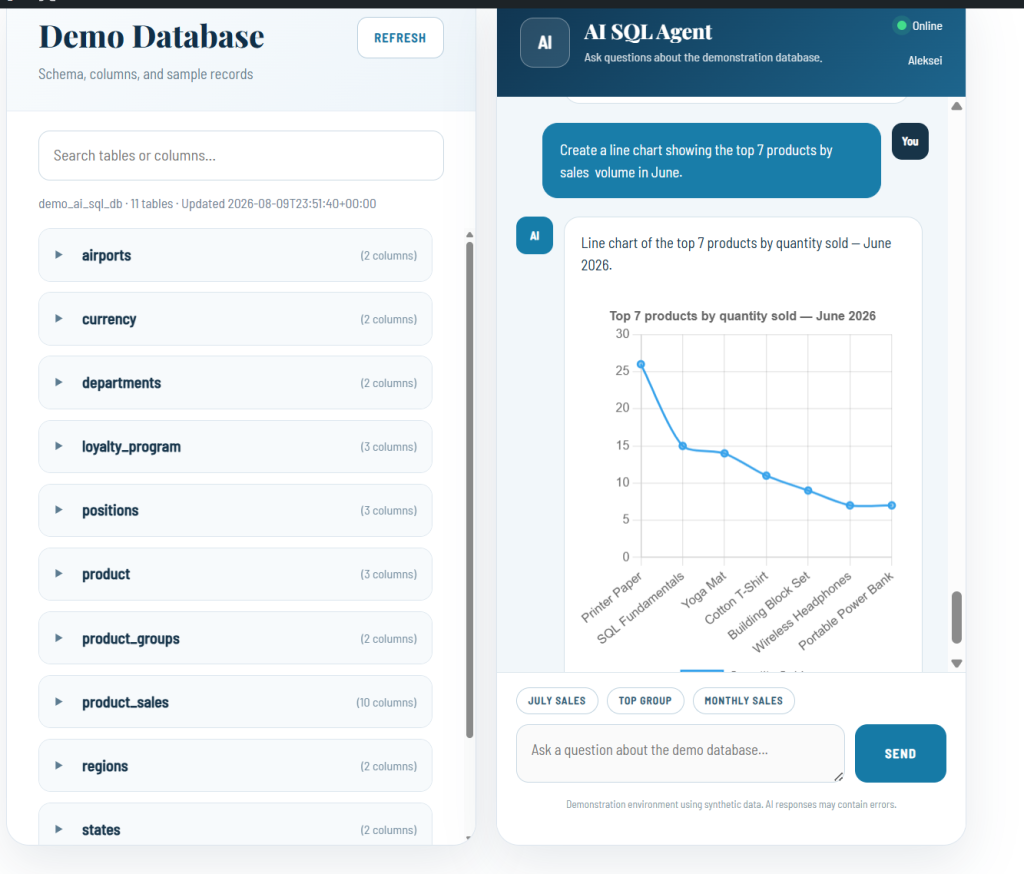
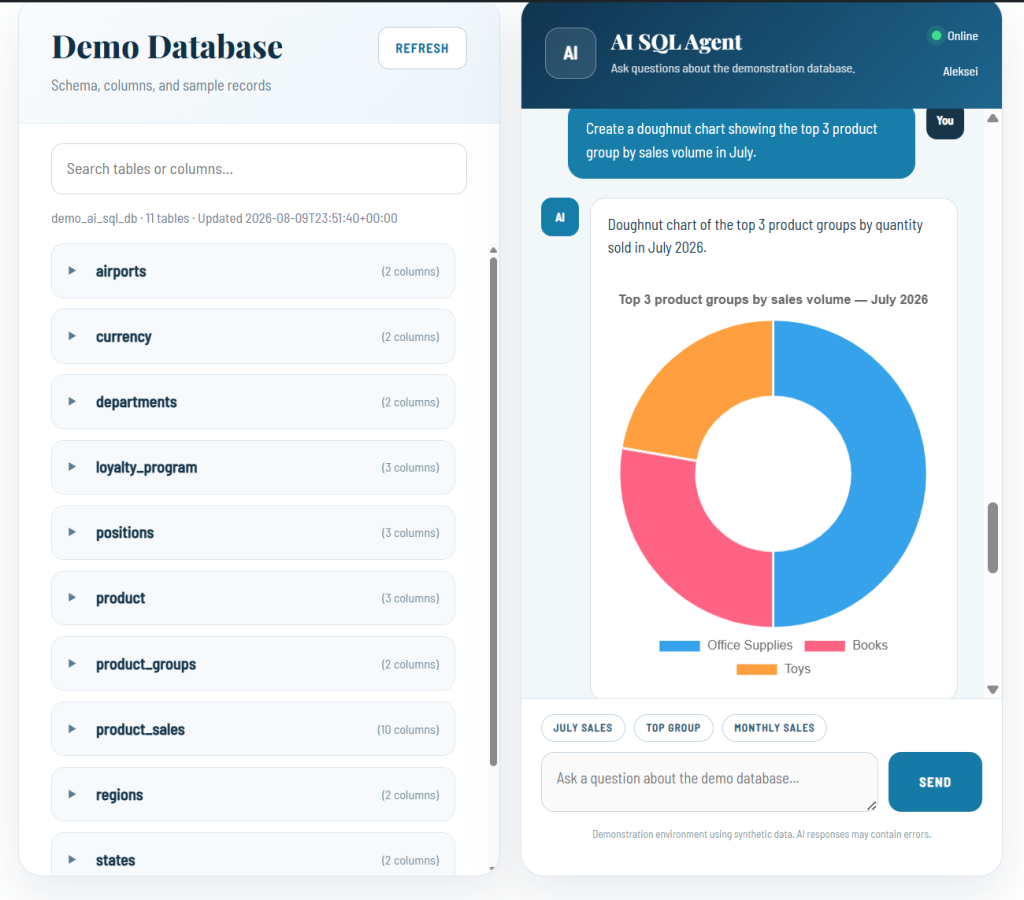
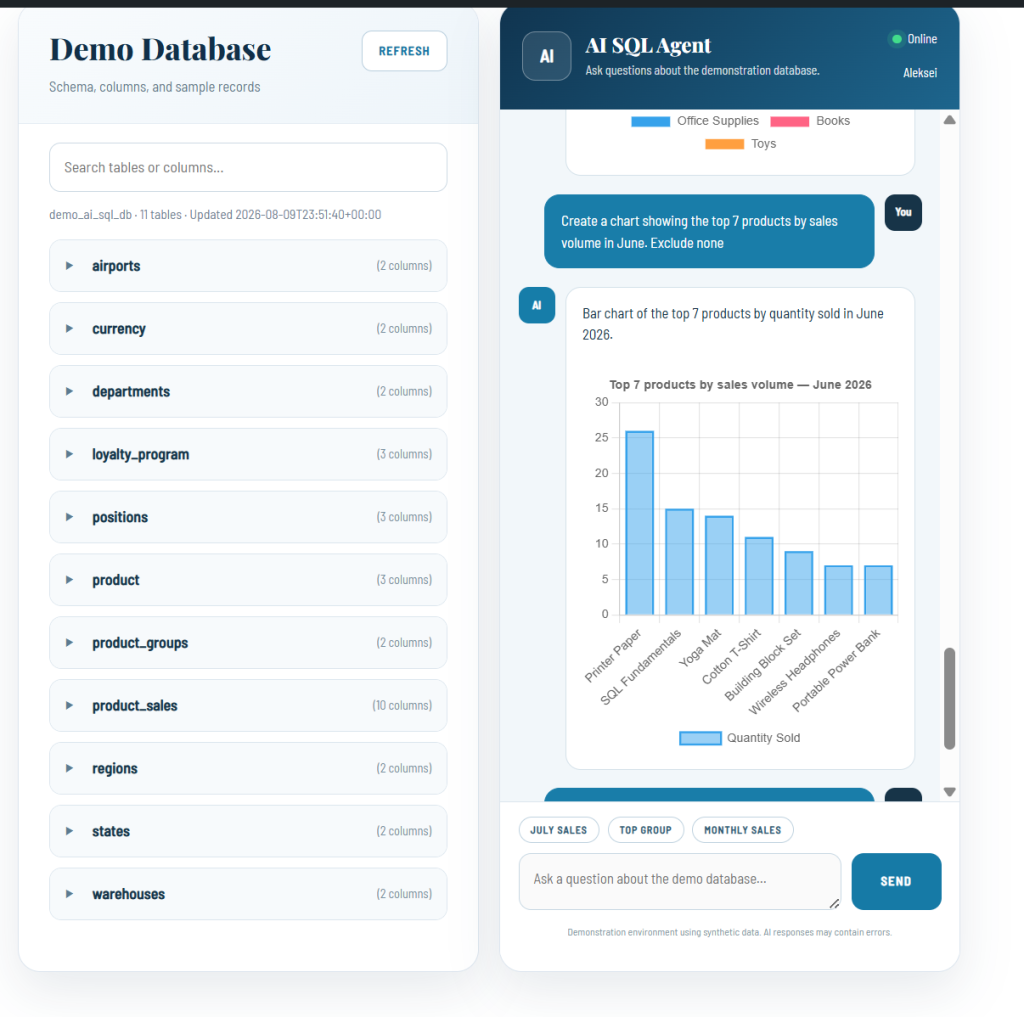
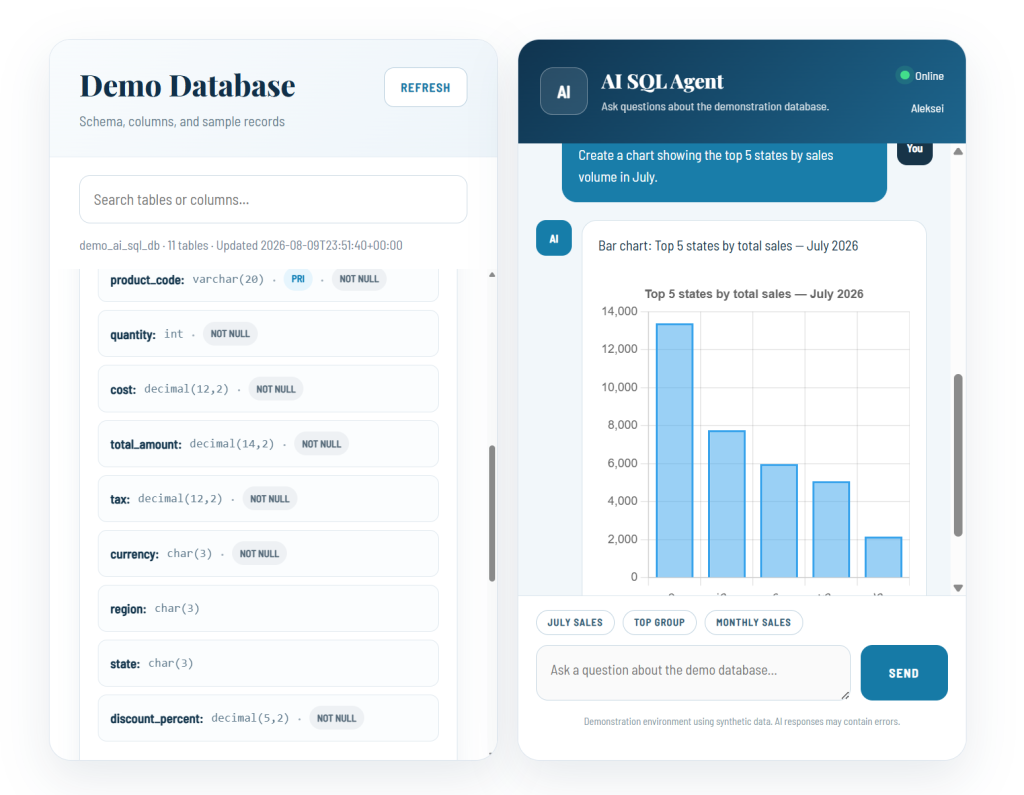
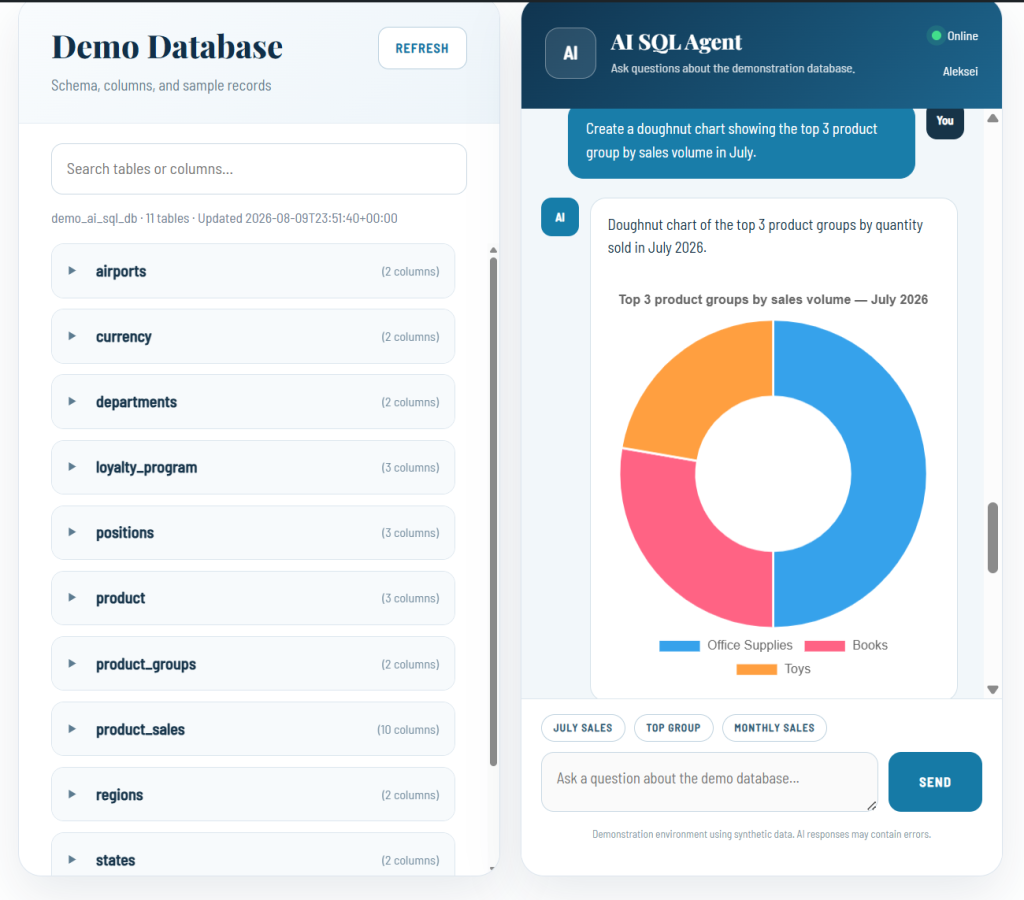
The latest version goes beyond generating SQL and displaying tables—it can now automatically create visualizations based on query results.
Users can simply ask questions like:
Show total sales by month
Display revenue by product group
Compare product sales in July
Create a pie chart of sales by category
The AI Agent will:
✅ Understand the natural language request
✅ Generate the appropriate SQL query
✅ Execute it against the database
✅ Return the data as an interactive chart
Current visualization capabilities include:
📈 Line charts for trends over time
📊 Bar charts for comparisons
🥧 Pie charts for category distributions
To make the experience even more intuitive, the website also provides a built-in Database Explorer where users can browse:
database schema
tables
columns
sample records
This allows users to understand the available data before asking questions and see exactly how the AI translates natural language into SQL.
The complete demo is built with:
Microsoft Azure App Service
Azure OpenAI
FastAPI
WordPress front end
Azure Database for MySQL
GitHub Actions CI/CD
This is another step toward my vision of building AI-powered engineering assistants that simplify SQL development, analytics, ETL, and enterprise data workflows.
#AI#ArtificialIntelligence#Azure#AzureOpenAI#DataEngineering#SQL#Python#FastAPI#WordPress#MySQL#DataVisualization#BusinessIntelligence#Analytics#GenerativeAI#EnterpriseAI#Automation#CloudComputing#GitHubActions#AIAgents#MicrosoftAzure